Friday, September 25, 2015

15.09.25 Daily Note : Changed Yellen?

1. Changed Yellen?

According to Yellen's speech last night, she and maybe other FOMC members seem to want to liftoff the interest rate until the end of this year, as given economic conditions. She changed the view about emerging countries from last week's FOMC meeting, to see the woes are not massive to effect on Fed's monetary policy trajectory.

In a conclusion, she said,
"I expect that inflation will return to 2 percent over the next few years as the temporary factors that are currently weighing on inflation wane, provided that economic growth continues to be strong enough to complete the return to maximum employment and long-run inflation expectations remain well anchored. Most FOMC participants, including myself, currently anticipate that achieving these conditions will likely entail an initial increase in the federal funds rate later this year, followed by a gradual pace of tightening thereafter. But if the economy surprises us, our judgments about appropriate monetary policy will change"

In her speech, she implicitly and explicitly argued inflationary dynamic continue to remain about 2% like 1990s and Fed not to forget the history that failing to follow elevated inflation despite there were some clues about that. It means maybe inflation dynamics are not linear. And Fed does not see this circumstance as the deflation. She said core PCE price is going to 2% gradually with downward pressure by temporary factors. U.S. economy is nearby the full employment condition and asset prices and consumption continue to improve, as they emphasized.

What caused this change for her now? Is not the change, but just tapping the market?
I believe Yellen tapped the market, not yesterday, but last week's FOMC meeting. She could be curious that the decision of monetary tightening amid easing environment in other development and emerging countries is right or not, while someone argued interest rate hike was needed for eliminating uncertainty at least. And then, she confirmed the consequence. It was tumbled stock price and weak emerging countries' asset prices and FX values. Furthermore, some economists started to argue the excessive easing policies could deteriorate sentiments of economic growth because of considering low rate as a signal of negative growth momentum. If then, rate hike could spur the economy ironically.

This result maybe enhanced the willingness of start of monetary tightening for Fed... And, in line with diminishing uncertainty, EM assets should not be weak further...


2. U.S. durable goods orders declined last month, but was slightly higher than market expectation.

Durable Goods NAICS ClassificationAugJulJunAug Y/Y201420132012
New Orders (SA, %)-2.01.94.1-1.96.82.26.3
  Transportation-5.85.010.80.86.16.516.6
Total Excluding Transportation-0.00.41.0-3.17.20.12.0
  Nondefense Capital Goods-2.00.710.7-7.56.62.810.8
    Excluding Aircraft-0.22.11.5-4.06.3-1.07.6
Shipments-0.01.00.91.14.82.06.3
Inventories0.0-0.20.42.56.12.43.8
Unfilled Orders-0.20.20.0-1.211.46.47.5


3. U.S. new home sales in August was up to high since 2008. Real asset markets, especially property or residential markets seem somewhat solid...


4. European PMI eased...while German IFO moved slightly higher this month.
These pictures show mixed signals for growth rate in 3rd and 4th quarter as economists expect recent growth rate could remain in 2nd half this year with somewhat downside risk.

How about Volkswagen? The possible end of autos with diesel engines could affect on European, especially German automobile industries significantly? or just temporary and once loss from disruption by U.S.?


5. Mario Draghi argued the importance of achieving inflation target in ECB even as use further or expanding monetary easing tools. Just bluffing? due to given, known, or expected higher inflation rate at the end of this year? or he really consider the downside risk on inflation with Chinese worries? This would be the key factor in global financial markets... The volatility would be too high until confirming this during one or two months...

6. Taiwan cut the policy rate since more than 6 years ago. And India is expected to cut the rate further in coming months as well... On going currency war?

7. Putin meets Obama for discussion about Syria and so on.

Wednesday, September 23, 2015

Credit Strategy : Decrease Auto sector Position in Short term, At Least

The financial shock from Volkswagen is widespread to whole automobile industries yesterday.

10 year Volkswagen (VW) Euro bond yield soared by more than 100bps during just 2 days, whilst German Bund yield with almost same maturity remained low seen in below graph.

Orange Line : VW 2024 Yield / White : German Bund 2024 Yield

Soaring VW bond yield is leading whole corporate bonds yields to be higher as well.
It effects especially into automobile industries abroad.
In below graph, we could find current soaring VW yield caused Euro industrial sector bonds spread widening. It is in line with the movement in equity markets yesterday, creating other auto companies' equity prices to tumble.

Orange : VW 2024 Yield / White : Barcap EuroAgg Industrial OAS

In fact, I have no idea about whether this picture would go on further or not. This picture means the whole credit bonds, especially automobile corporate bonds prices could be deteriorated due to the side effects or spill over effects from worsening Volkswagen bonds prices. Someone argues this picture would be an opportunity to increase the position on the opposite side because current issue would be with Volkswagen only, not widespread.

But I plan to decrease the automobile sector position as considered worse scenario because I think the expected value is tilted toward negative side. In a credit bond market, we have to move earlier. If we approach to buy one, the gain would be small, but the loss would be massive.

So, I will sell some bonds in automobile sector and buy UST today. The position would be changed from slightly OW in automobile sector now, selling U.S. corps due to not having VW or other Euro automobile companies bonds, to slightly UW.

Besides, I plan to buy longer duration treasury bond against automobile sector bond. Selling 2.5 yr Ford bond and buying 7 yr UST, exactly, to cover short duration position very slightly. My conviction that the long-end yield should be pushed higher at the end of this year is weakened... while my position remains short now...

Summary of Federal Reserves Business Survey Indices in Charts

Some feds' business survey indices show negative activities in manufacturing industries recently.
How is it going?


15.09.23 Daily Note

1. China manufacturing PMI flash recorded 47.0 lower than expected 47.5 and previous month's 47.3. It is the lowest level for 6 and half years.
New orders index declined from 46.6 to 46.0 and output index lowered to 45.7 from 46.4.

2. Russia seeks to enhance power in Syria. Is it hopeful for U.S.? Time to increase the position in Russian assets?

3. Xi arrived U.S...

4. The EU reached agreement on a plan to relocate 120k migrants over 2 years, but 4 nations opposed the proposal.

Tuesday, September 22, 2015

15.09.22 Daily Note

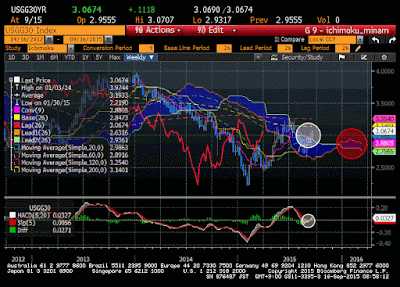
1. UST 30 year yield soared over 3.0% again. Where it goes? I remain short position in longer tenor...

2. S&P warned Chinese bank risks in terms of vulnerable positions with weak property markets, while the price started to upturn recently...

3. Russia and Iran have stepped up coordination in Syria, creating a new complication for U.S. diplomatic goals. Going to talk? If then, increase in energy price is possible?

4. BDI and SHCOMP inched up further today.

5. Weekly strategy note may be passed this week... I have to prepare my business trip for next week...

Time to Overweight EM Sovereign bonds against UST?

All fear about monetary tightening by U.S. Fed, while Prime Minister in Indonesia which is one of vulnerable countries in Asia argued interest rate hike was essential to decrease uncertainty rather than increase additional market turmoil.

What is the truth?

EM bonds spreads have been widened since 2nd half last year due to oil price tumbles and strong USD very rapidly. After temporary decline in spread in 1st quarter this year caused by upturned oil price, the spread restarted to widen further with Chinese economic slowdown fears and ahead of possible U.S. Fed first rate hike.

But there is somewhat different. It's portfolio flow of debt assets from abroad to EM. According to IIF, Institute of International Finance, this inflow turned to increase since 2nd quarter this year. That said, recent price adjustment has not been with sell-off by foreign investors.

Yes. I believe Fed should raise the interest rate soon. But, while I expect bond yield to soar somewhat rapidly, EM bonds could outperform USTs, that means the spread tightening. Yet, almost participants seem to cautious to invest into EM ahead of Fed's tightening and possibly additional capital outflows.

In current environment, the uncertainty is likely more important factor in EM bonds markets.
Is it time to buy the fear?


Monday, September 21, 2015

15.09.21 Daily Note

1. U.S. leading indicator and coincident indicator was up in August, while lower than lagging data.
Especially, coincident data is much slower than lagging data as the ratio have declined somewhat faster. That said, current condition is worse than before, but futures would be brighter... But, this story is already old since 2013... Where is the bright side?

Business Cycle Indicators (%)AugJulJunAug Y/Y201420132012
Leading0.10.00.64.45.83.32.1
Coincident0.10.40.12.32.51.92.6
Lagging0.20.30.93.83.83.83.1


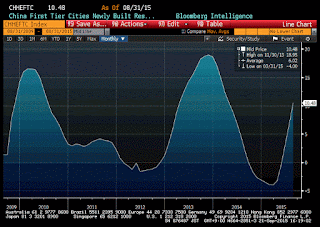
2. Main problem, in China, the 1st tier residential prices rose more than 10% year over year in August. SHCOMP was up 1.9% today....


...while CDS 5y premium soared somewhat rapidly making up last week's decline.


3. FBI investigates Malaysian fund while the scope of the investigation wasn't known.

4. Volkswagen equity price is tumbling by more than 20% now...

5. Weekly strategy has to be written...maybe tomorrow...

Friday, September 18, 2015

Answer from LSR, About UST Indirect Bidder in Auction and Quantitative Tightening

About previous post,
LSR answered...But, they are not clear...
They only suggest yearly sum data, not emphasized on recent soared yield...


Thursday, September 17, 2015

The Opposite View on Quantitative Tightening

There are other criticism against so-called quantitative tightening.
According to LSR, some evidences underpin their opposite view on it.

LSR suggests declining global foreign reserves had not caused soaring UST 10 year yield during recent a decade with a left hand side graph. They argue the environment been with declines in foreign reserves mostly had led risk aversion trading made US treasury bond yield lower.

But, I think their calculation using change rate year over year is not adequate because the difference seems not significant. The change of global foreign reserves should been compared in longer term as I and many participants suggest the main difference between 2004 and now, both of ahead of Fed monetary tightening.


On the right hand side graph, LSR argues demands for long-end tenor US treausry bond are sufficient. They provide higher participation rate of amount accepted indirect bidders, considered as foreign main investors' demand including central banks and mutual funds, on 10 year and 30 year tenor.

However, I think there somewhat fault in their analysis.

Higher accepted indirect bid could be caused by lower amount of direct bid. So, we should check not accepted bidder amount, but tendered bidder amount considering whole size of bidders. See the below charts.

Direct Bidder Amount Tendered in 30 year Auction

In 30 year treasury bill auction, direct bidder amount tendered decreased sharply since start of this year. Higher indirect bidder acceptances maybe were caused by this.

Indirect Bidder Amount Tendered in 30 year Auction

In contrast of LSR's graph, this chart shows real amount of indirect bidders tendered is not higher than start of this year.

Indirect Bidder Amount Tendered in 10 year Auction

Even in 10 year tenor, the indirect bidder amount tendered started to decrease since May shown in this graph.

I will ask LSR about this...

15.09.17 Daily Note : Ahead of Upcoming FOMC meeting

Ahead of FOMC meeting,

1. Oil price rose more than 5% with decreased inventories data in U.S. So, commodities exporters' currencies such as BRL and RUB were appreciated in line with others including TRY.

The WTI price met the 1st leading span in Ichimoku chart signaling resistance point, ahead of upcoming FOMC meeting... Where will USD go after FOMC meeting? And then, how about oil price? In a weekly chart, upside potential for oil price seems sufficient... Tonight, could the price break this resistance line?


2. U.S. CPI decline reflected lower energy costs and core-CPI rose minimally.

Consumer Price Index, All Urban Consumers (%)AugJulJunAug Y/Y201420132012
Total-0.10.10.30.21.61.52.1
Total less Food & Energy0.10.10.21.81.71.82.1
  Goods less Food & Energy-0.1-0.1-0.1-0.5-0.3-0.01.3
  Services less Energy0.10.20.32.62.52.42.4
 Food0.20.20.31.62.41.42.6
 Energy-2.00.11.7-15.0-0.3-0.70.9

3. The Composite Housing Market Index from the National Association of Home Builders-Wells Fargo, NAHB index, improved to 62 (5.1% y/y) from an unrevised August level of 61. It was the highest level since October 2005 and beat expectations for 61 in the Informa Global Markets Survey.

Housing market seems quietly residential for now.
How the market will be after starting to tighten monetary policy by Fed?


4. Euro area headline and core inflation rates were revised down by 0.1pp to +0.1% and +0.9%, year over year, respectively, from flash data.

And there are other news,

5. China liquidated a record $83 billion in U.S. treasuries in July, via Z.H


6. Glencore, reviewed at a glance in previous post, said it raised $2.5 billion by selling new shares to a select group of institutional investors. The stock issuance is part of a $10 billion plan to cut Glencore's debt.

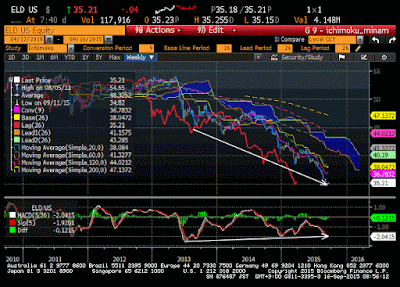
Below is a daily chart. MACD divergence signals the possible upturn soon...


7. 8.3 Magnitude earthquake strikes off coast of Chile.

8. S&P downgraded Japan's sovereign credit rating to A+ from AA- yesterday due to weakening economic growth, while no impact is on local government bond yield...

Wednesday, September 16, 2015

15.09.16 Daily Note

1. U.S. White House announced it does not support lifting a ban of oil exports. So, oil price soared after that slightly... It seems not significant issue for oil market yet...

2. S&P500 index and Dow Jones rose more than 1%. Someone says yesterday's U.S. equity market strengthening as a result of delayed possible timing of Fed's fund rate hike due to subdued retail sales data. But, as I commented, the data was not negative, so treasury bond yields soared rapidly. See the another post about this.

Rather, we should interpret equity market movement as the fear about interest rate hike starts declining with firm real economic data. Risk asset markets are alive.

So, we have to avoid underweight position on industrial corporate bonds as I planned.

3. SHCOMP closed up +4.9%

U.S. Corporate Bond Spread : Time to Transfer from Financial to Industrial Sector?

Does the burden of increased issues of U.S. corporate bonds finish?
Time to increase credit position and transfer from financial, the most stable sector, to industrial sector? In line with somewhat solid economic improvement?

Let's move ! Sell Goldman Sachs 2041 and Buy British Telecom 2030!
This transaction to decrease duration position and longer-end exposure also aims at adjustment ahead of FOMC meeting.

Barclays US Agg. Credit Avg OAS
Spread between Barcap Industrial OAS and Financial OAS
New Security Issues of U.S. Corporate Bonds
Yield Spread : GS 2041 vs. BRITEL 2030

Ahead of U.S. Fed tightening, Where is EM Local Bonds Going?

Below charts are about the representative ETF for emerging countries' local bonds.
As you know, EM local bonds have recorded negative return mainly due to tumbled FX rate.
And we are ahead of U.S. Fed tightening which have been a main fear of EM.

Where is EM local bonds going from now?
Ironically, MACD divergence indicates possible turnaround in both of daily and weekly candle charts...

Is this timing to invest EM local bonds?


Agriculture Price Update : Turnaround !

As I forecast in a previous post, agriculture price started to turnaround.
Recent robust movement partly is caused by USDA report publishing smaller inventory of wheat and so on.
And Australia referred El Nino would persist to early 2016, even this effect is somewhat vague for commodity price.

As a consequence, global inflationary pressure could arise toward end of this year...!

U.S. Treasury 30 year Bond Rate is Robust over the Resistance Line, 3.0% at last !

As I posted earlier, the resistance point, 3.0%, for a U.S. treasury bond 30 year, yesterday despite not so good retail sales data even lower than market expectation, albeit I think the data was some what good.

Ahead of FOMC meeting, almost participants focus on whether hike rate or delay it.
But, long-end yield would not be affected by the timing of rate hike. We continue to be cautious on long-end bond yields until end of this year...

German Bund rate was up as well, despite somewhat sluggish ZEW data.

Growth data or sentiment does not seem important for long-end bond yields...
More important factors would be inflationary pressure, or diminishing deflation worries, and a lack of demand...


Will ZEW Expectation Indicator Likely Lead Possible Tumbling Current Conditions?

ZEW expectation indicator lost further, whilst current condition index somewhat gains...

U.S. Retail Sales and Industrial Indicators show Firm Growth

Retail sales in August increased 0.2% from previous month in U.S. a little lower than expected 0.3%. Excluding autos sales increased 0.1% lower than expectation of 0.2% as well.

Although the data is slightly lower than market expectation or consensus, the sales growth does not seem low. Under subdued price condition, nominal sales growth is also under the downward pressure. And especially, market participants who seemed to expect U.S. economic turmoil were likely to predict downward revision of July's number, very high, 0.7%. But, there were little revision in July and June data. This points U.S. economic recovery is going on.

Retail Spending (%)AugJulJunAug Y/Y201420132012
Total Retail Sales & Food Services0.20.7-0.01.63.93.75.0
  Excluding Autos0.10.60.40.43.12.74.1
  Non-Auto Less Gasoline, Building Supplies & Food Services0.40.60.32.83.32.73.6
Retail Sales0.10.8-0.11.03.73.84.9
  Motor Vehicle & Parts0.71.3-1.65.87.58.39.0
 Retail Less Autos-0.00.60.4-0.52.62.63.9
  Gasoline Stations-1.8-0.61.2-17.1-2.7-0.74.3
Food Service & Drinking Places Sales0.70.30.36.16.23.45.9

Industrial data in U.S. was somewhat sluggish. But this aspect was expected with the burden of inventory ratio against sales during recent months. Decline in inventories is not bad news.

Capacity utilization rate in August dropped to 77.6% from previous month's 78.0% and lower than market expectation, while higher than 77.4% recorded in June.

Tuesday, September 15, 2015

EM GDP and Economic Size was Overstated via Deutsche Bank

Via DB,

(1) The recent slowing in China and EM more broadly has raised concerns about the level and sustainability of global growth;

(2) But EM growth has been slowing for the last 5 years, while DM growth picked up and global growth over the last few years has been perfectly steady at near trend rates, measured using conventional PPP exchange rate weights;

(3) Conventional PPP exchange rate based measures massively overstate the size of EM in the global economy: by $35 trillion or 2 US GDPs;

(4) Global growth has been rising over the last few years when measured using market exchange rate based weights;

(5) The arithmetic of global growth: DM (60%) is still bigger than EM (40%) and 1pp of additional DM growth offsets 1.5pp of slower EM growth;

(6) We expect a continued normalization of EM growth lower though we are almost there; DM growth to pick up; and global growth (i) at conventional PPP weights to be near trend rates while (ii) at market rate weights to accelerate above trend rates in 2016


2015.09.15 Daily Note

1. S&P upgraded Korean sovereign credit ratings to AA- followed previous Moody's and Fitch.

2. BOJ holds the asset purchase program. JPY appreciated.

3. KTB futures was strong after the clearance of maturity. Foreign investors are still on long position.

Who Bought U.S. Treasury bonds against Sell-off by China

In a previous post, we could confirm starts of decline in global foreign reserves since 3rd quarter last year, signaling realized sell-off U.S. treasury bonds and German Bunds especially in a long-end tenor. So, market participants this as the Quantitative Tightening.

And then, who bought treasuries against sell-off by EMs including China particularly?
We couldn't guess that obviously because of a lack of data. U.S. FRB released data until 2nd quarter without details of total private demand in September, this month, report.

So, we should estimate the possible demand as use of limited data. See the below chart about yearly change of U.S. treasury holdings, billion dollars, by main drivers for recent years.

(1) U.S. banks have increased treasury bond position continuously as known that they have to increase due to Volker Rule. The pace have been somewhat rapid to be sufficient to underpin the bond price for couple of years. In 2nd and 3rd quarter, they may have increased treasury bond position as considering sell-off by PBoC as the opportunities. If then, however, the pace of buying should not maintain permanently. Their bought would end when their capital ratios are sufficient. In fact, the speed seemed to turn slow since mid 2014.

(2) U.S. mutual funds positions have been enhanced since early 2014 when the fear about QE tapering started to diminish. And the size of bond funds have been in line with lowering bond yields during couple of years. But, they are not market makers, but followers. So, if the rates set the direction toward upside, the outflow from mutual bond funds would arise.

(3) Last, foreign private demands. They are the biggest demand sides to increase holdings for U.S. treasury bonds. Someone argues this side should offset the sell-off by EMs' central banks from decreasing foreign reserves.

But, we should consider foreign private investors as diversify various parts such as insurance companies, pension funds, mutual funds and banks. Total numbers hardly suggest something special. Anyway, this total number, increasing size from a previous year, started to decline since 3rd quarter last year in line with global foreign reserves. This means foreign private investors are not free from capital outflows.

So, if additional sell-off by EMs comes, the bond yield could be pushed higher, I believe, while this data does not suggest recent months' demands for U.S. treasury exactly yet.

Source : Treasury's Bureau of the Fiscal Service

Monday, September 14, 2015

Weekly Global Fixed Income Investment Strategy : Still Cautious on a Long-end Tenor Yield

Yesterday, in weekend, Chinese government released industrial production and retail sales data, on a yearly growth rate, in August. As consequences, I.P. was weaker than expected, while retail sales was resilient. As a part of this, some Asian equity markets, such as SHCOMP, Nikkei225, and Kospi were down today despite it was not critical movement.

But, the plunged industrial production growth signal the whole economy slowdown in China?
As China is one of the biggest exporters for the world, the industrial production could be influenced by global demand mainly, not Chinese domestic economy. For following Chinese own economy, likewise we usually consider imports data in another post, we should check retail sales rather than industrial production.

In fact, Chinese economy is on a slowdown to be set and adjusted in new normal growth. This is what we all know. Given this, we could see the higher retail sales growth than industrial production since mid 2000s. As we saw in a history about Chinese capital control, Chinese government started to reform economic model to boost domestic consumption as permit strengthening Renminbi since mid 2000s, and the growth of retail sales have maintained higher level than industrial output. On the other hand, since late 1990s, industrial output growth had been higher than retail sales, when China decided to adopt export-led economic model.


Chinese retail sales growth is relatively high over 10% yearly. So, I think current woes about Chinese economic slowdown or crisis are overstated.

In a contrast of lowering target of oil price posted previously, Goldman Sachs published global fixed income market report arguing upside potential for long-end tenor yield as current pricing inflation is too low against expected rate. This is absolutely equal to my view.

They suggest recent yield drop since June this year has been caused mainly by lowering inflation expectation with a below chart.


Actually, we could confirm this as a comparison of US treasury 10 year bond yield and WTI price with a below chart.


As they noted, the oil price impact on CPI should be shrunk from 4th quarter this year, albeit Goldman Sachs predicts further fall in oil price. If then, long-end tenor could be pushed higher, especially in line with the start of Fed funds rate hike in the end of this year. This is not by growth factor yet, but by the inflation rate from a year earlier.

So, I maintain my position announced last strategy.

Goldman Sachs Lowered Targeting Oil Price Once Again

Last weekend, the oil price tumbled as Goldman Sachs lowered targeting oil price once again.


On a daily candle Ichimoku chart, the price fell ahead of negative cloud with somewhat burden from high level of MACD.

GS lowered target level to 38 dollar per a barrel, 42, 40, and 45 in 1 month, 3, 6, and 12 month, respectively. 2016 target is 45 USD/bbl, which is around last Friday's price, 44.63. Their previous target price was 57, and current implied price in forward is at 51.

Moreover, they consider $20/bbl as a downside potential price.


However, there are nothing special rationales in GS report.
They suggest the oil market is even more oversupplied than they had expected and they forecast this surplus to persist in 2016 on

(1) further OPEC production growth,
(2) resilient non-OPEC supply
(3) and slowing demand growth with skewed to even weaker demand given China's slowdown and its negative EM feedback loop.

At the same time, they provide below picture.
They argue the surplus condition would remain until 3rd quarter next year, so this over supply should weigh on the oil price continuously.


But, let's draw a pointing line as a given red line meaning the growth momentum. The size of over-supply starts to decline since 2nd quarter this year seen as an inflection point. As I know and experienced, the growth rate or momentum is more important than whether the level is positive or negative in financial markets. Besides, I don't believe additional turmoil in Chinese demand capacities.

Goldman Sachs is bluffing, even now, I think.

At a glance, About Glencore

Glencore published the plan to decrease debt through muting dividend and selling own-hold equities. They purpose a decline of debt, from current $ 30 billion to $ 10 billion within a few years.

Nevertheless, the equity price tumbled rapidly, while CDS premium soared.
What is the impact from default, or possibility of it, of Glencore in commodities markets?

What is Glencore?
Is it a kind of mining company or commodity trading company?
Until 2011, before IPO, it was a commodity trading company which had influenced global commodity market obviously. Someone considered Glencore as a invisible hand for global commodity market.
Recently, as Glencore announced a plan to decrease productions of copper, the copper price got the additional momentum to be robust. And then, is Glencore a mining company?

Additional analysis should be conducted...

White Line : Equity Price / Orange Line : CDS Premium